Description
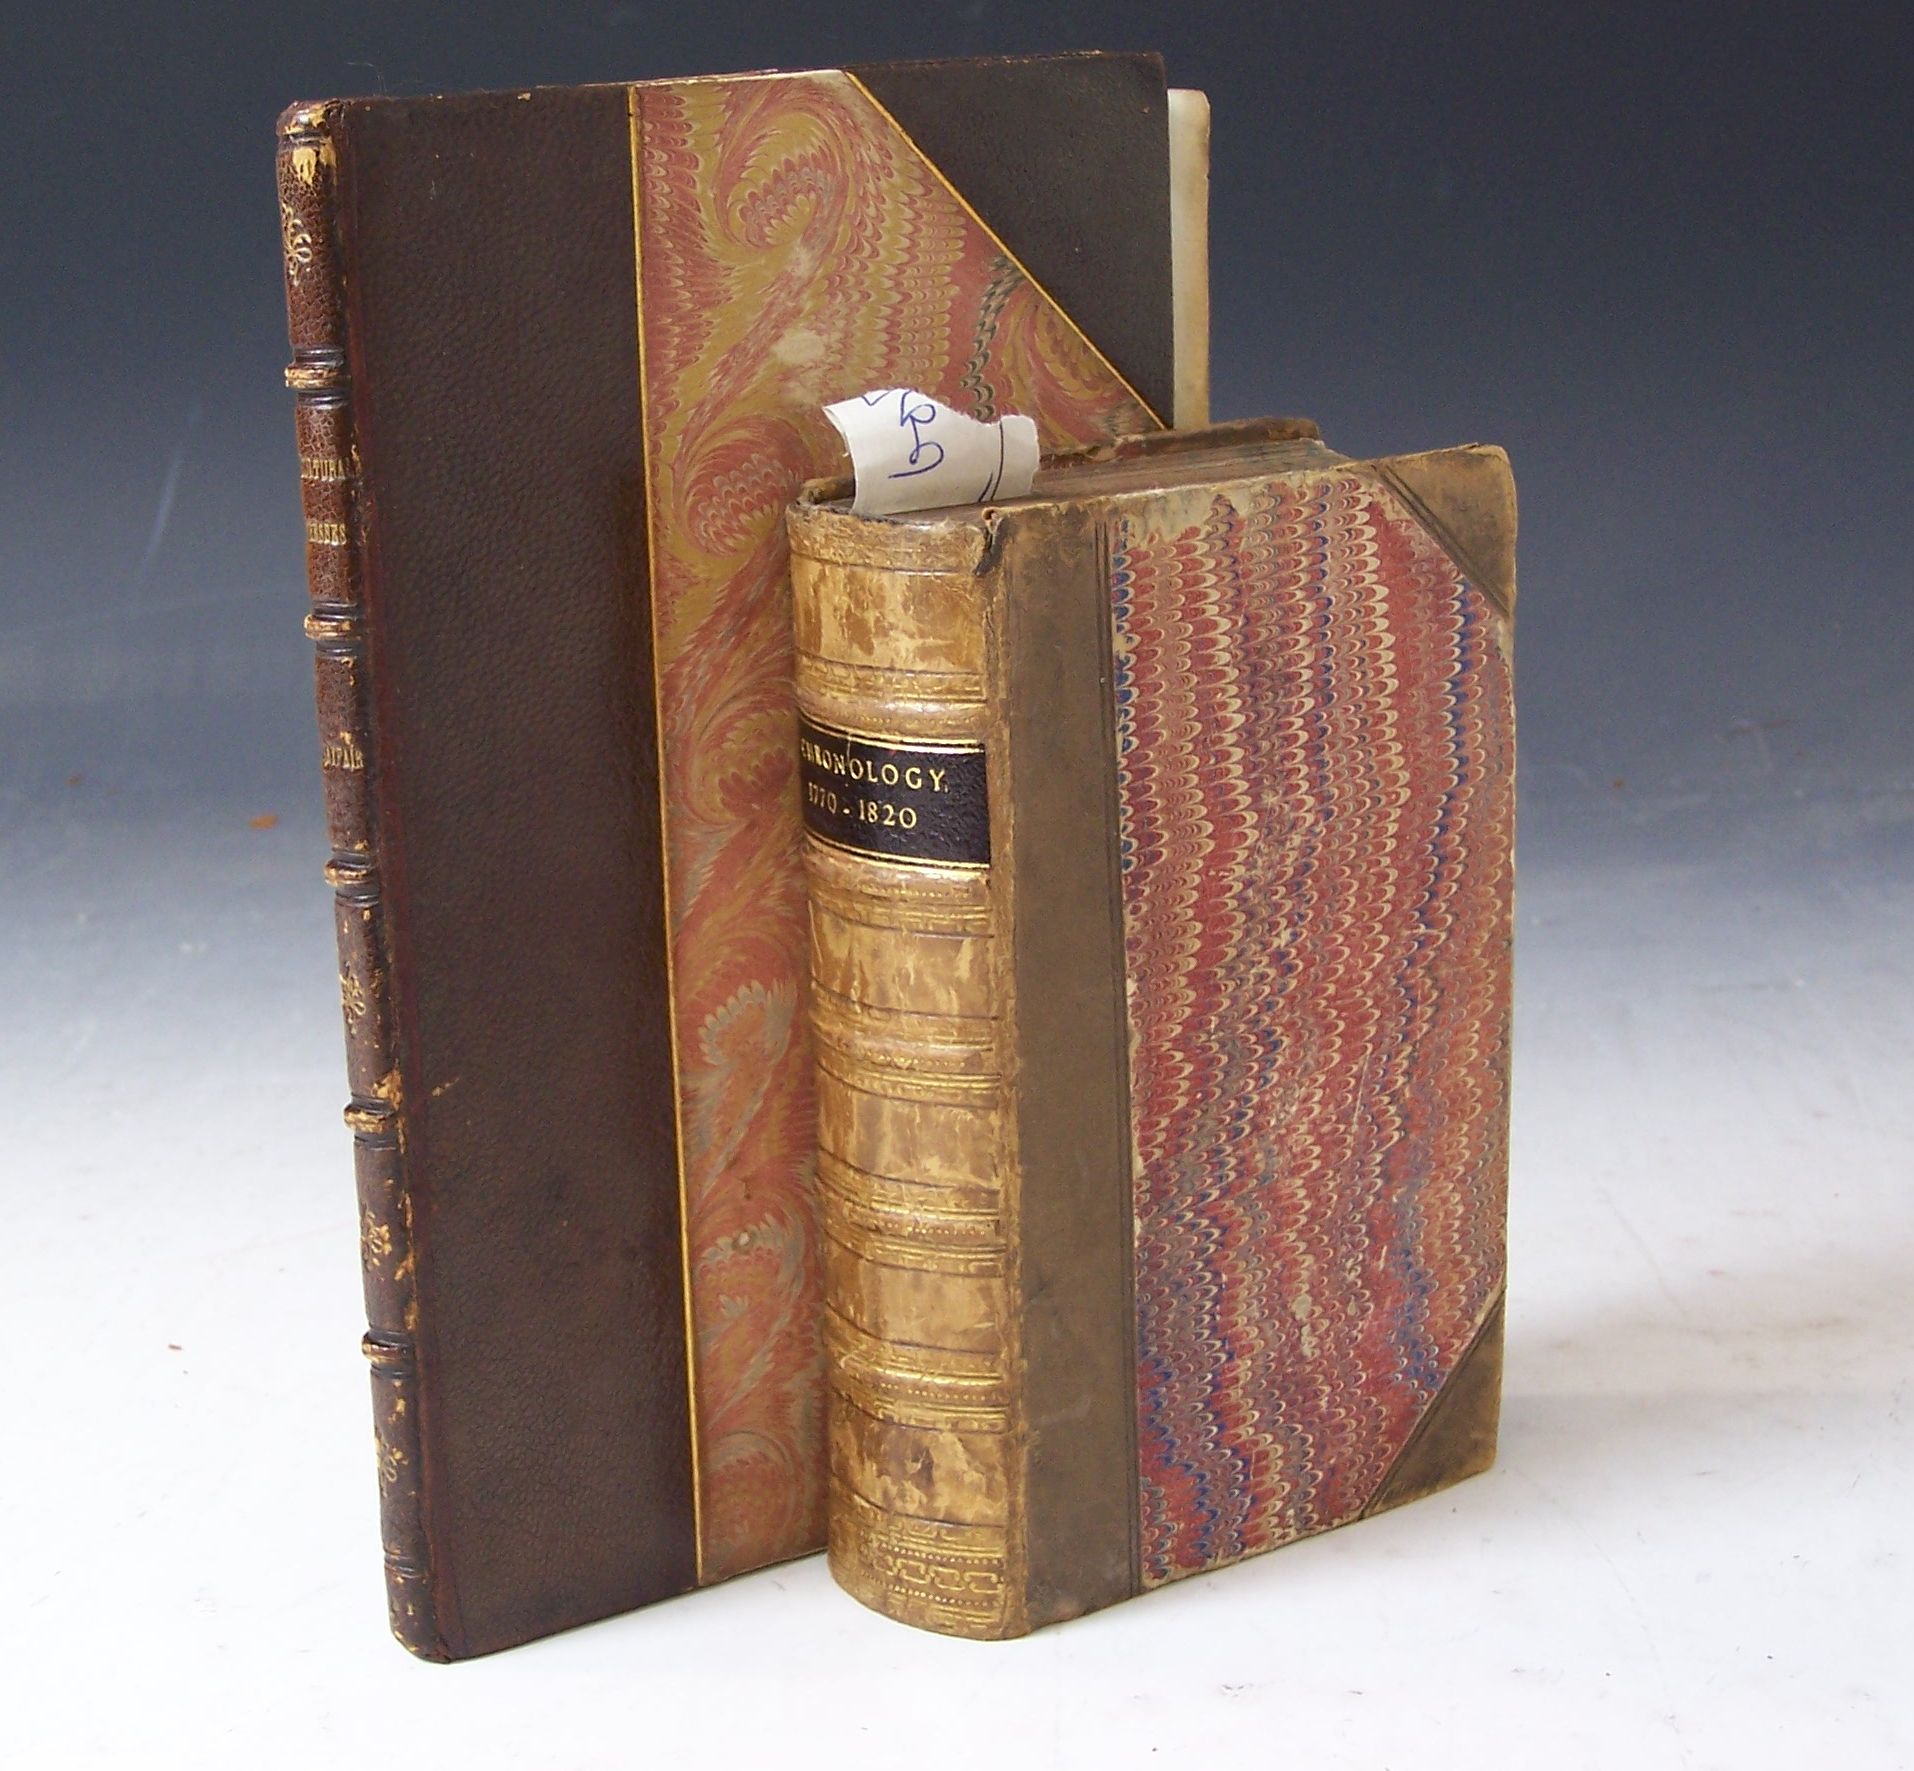
A letter on our agricultural distresses, their causes and remedies, accompanied with tables and copper-plate charts shewing and comparing the prices of wheat, bread, and labour, from 1565 to 1821. London: W. Sams, 1821. 8vo [viii, 72], 3 folding engraved charts partly hand-coloured, 19th century brown half morocco by Zaehnsdorf, neatly rebacked retaining original spine; [Chronology] Chronology of public events and remarkable occurrences within the last fifty years, or from 1770 to 1820. London: for Sir Richard Phillips & Co., [1820]. 12mo, folding engraved chart by William Playfair, with hand-colouring, slight foxint to chart, contemporary half calf, slightly rubbed, new black morocco label (2)
Footnote
Note: 2009 marks the 250th anniversary of the birth of William Playfair [1759 –1823] , Scottish engineer and political economist, the founder of graphical methods of statistics. Playfair invented four types of diagrams: the line graph and bar chart of economic data, which first appeared in his Commercial and Political Atlas, published in 1786, and the pie chart and circle graph, used to show part-whole relations.